Flink Network Stack Vol. 2: Monitoring, Metrics, and that Backpressure Thing
July 23, 2019 - Nico Kruber Piotr Nowojski
In a previous blog post, we presented how Flink’s network stack works from the high-level abstractions to the low-level details. This second blog post in the series of network stack posts extends on this knowledge and discusses monitoring network-related metrics to identify effects such as backpressure or bottlenecks in throughput and latency. Although this post briefly covers what to do with backpressure, the topic of tuning the network stack will be further examined in a future post. If you are unfamiliar with the network stack we highly recommend reading the network stack deep-dive first and then continuing here.
Monitoring #
Probably the most important part of network monitoring is monitoring backpressure, a situation where a system is receiving data at a higher rate than it can process¹. Such behaviour will result in the sender being backpressured and may be caused by two things:
-
The receiver is slow.
This can happen because the receiver is backpressured itself, is unable to keep processing at the same rate as the sender, or is temporarily blocked by garbage collection, lack of system resources, or I/O. -
The network channel is slow.
Even though in such case the receiver is not (directly) involved, we call the sender backpressured due to a potential oversubscription on network bandwidth shared by all subtasks running on the same machine. Beware that, in addition to Flink’s network stack, there may be more network users, such as sources and sinks, distributed file systems (checkpointing, network-attached storage), logging, and metrics. A previous capacity planning blog post provides some more insights.
1 In case you are unfamiliar with backpressure and how it interacts with Flink, we recommend reading through this blog post on backpressure from 2015.
If backpressure occurs, it will bubble upstream and eventually reach your sources and slow them down. This is not a bad thing per-se and merely states that you lack resources for the current load. However, you may want to improve your job so that it can cope with higher loads without using more resources. In order to do so, you need to find (1) where (at which task/operator) the bottleneck is and (2) what is causing it. Flink offers two mechanisms for identifying where the bottleneck is:
- directly via Flink’s web UI and its backpressure monitor, or
- indirectly through some of the network metrics.
Flink’s web UI is likely the first entry point for a quick troubleshooting but has some disadvantages that we will explain below. On the other hand, Flink’s network metrics are better suited for continuous monitoring and reasoning about the exact nature of the bottleneck causing backpressure. We will cover both in the sections below. In both cases, you need to identify the origin of backpressure from the sources to the sinks. Your starting point for the current and future investigations will most likely be the operator after the last one that is experiencing backpressure. This specific operator is also highly likely to cause the backpressure in the first place.
Backpressure Monitor #
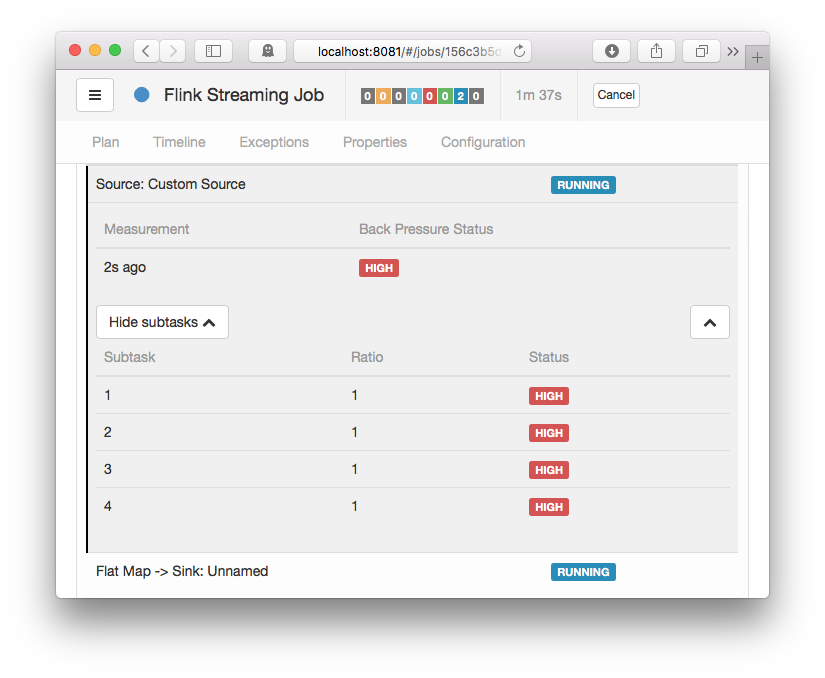
The backpressure monitor is only exposed via Flink’s web UI². Since it’s an active component that is only triggered on request, it is currently not available via metrics. The backpressure monitor samples the running tasks’ threads on all TaskManagers via Thread.getStackTrace() and computes the number of samples where tasks were blocked on a buffer request. These tasks were either unable to send network buffers at the rate they were produced, or the downstream task(s) were slow at processing them and gave no credits for sending. The backpressure monitor will show the ratio of blocked to total requests. Since some backpressure is considered normal / temporary, it will show a status of
- OK for
ratio ≤ 0.10, - LOW for
0.10 < Ratio ≤ 0.5, and - HIGH for
0.5 < Ratio ≤ 1.
Although you can tune things like the refresh-interval, the number of samples, or the delay between samples, normally, you would not need to touch these since the defaults already give good-enough results.
2 You may also access the backpressure monitor via the REST API: /jobs/:jobid/vertices/:vertexid/backpressure
The backpressure monitor can help you find where (at which task/operator) backpressure originates from. However, it does not support you in further reasoning about the causes of it. Additionally, for larger jobs or higher parallelism, the backpressure monitor becomes too crowded to use and may also take some time to gather all information from all TaskManagers. Please also note that sampling may affect your running job’s performance.
Network Metrics #
Network and task I/O metrics are more lightweight than the backpressure monitor and are continuously published for each running job. We can leverage those and get even more insights, not only for backpressure monitoring. The most relevant metrics for users are:
-
up to Flink 1.8:
outPoolUsage,inPoolUsage
An estimate on the ratio of buffers used vs. buffers available in the respective local buffer pools. While interpretinginPoolUsagein Flink 1.5 - 1.8 with credit-based flow control, please note that this only relates to floating buffers (exclusive buffers are not part of the pool). -
Flink 1.9 and above:
outPoolUsage,inPoolUsage,floatingBuffersUsage,exclusiveBuffersUsage
An estimate on the ratio of buffers used vs. buffers available in the respective local buffer pools. Starting with Flink 1.9,inPoolUsageis the sum offloatingBuffersUsageandexclusiveBuffersUsage. -
numRecordsOut,numRecordsIn
Each metric comes with two scopes: one scoped to the operator and one scoped to the subtask. For network monitoring, the subtask-scoped metric is relevant and shows the total number of records it has sent/received. You may need to further look into these figures to extract the number of records within a certain time span or use the equivalent…PerSecondmetrics. -
numBytesOut,numBytesInLocal,numBytesInRemote
The total number of bytes this subtask has emitted or read from a local/remote source. These are also available as meters via…PerSecondmetrics. -
numBuffersOut,numBuffersInLocal,numBuffersInRemote
Similar tonumBytes…but counting the number of network buffers.
Overall, we discourage the use of outputQueueLength and inputQueueLength because their interpretation highly depends on the current parallelism of the operator and the configured numbers of exclusive and floating buffers. Instead, we recommend using the various *PoolUsage metrics which even reveal more detailed insight.
- Any outgoing channel which has been used at least once will always occupy one buffer (since Flink 1.5).
- up to Flink 1.8: This buffer (even if empty!) was always counted as a backlog of 1 and thus receivers tried to reserve a floating buffer for it.
- Flink 1.9 and above: A buffer is only counted in the backlog if it is ready for consumption, i.e. it is full or was flushed (see FLINK-11082)
- The receiver will only release a received buffer after deserialising the last record in it.
The following sections make use of and combine these metrics to reason about backpressure and resource usage / efficiency with respect to throughput. A separate section will detail latency related metrics.
Backpressure #
Backpressure may be indicated by two different sets of metrics: (local) buffer pool usages as well as input/output queue lengths. They provide a different level of granularity but, unfortunately, none of these are exhaustive and there is room for interpretation. Because of the inherent problems with interpreting these queue lengths we will focus on the usage of input and output pools below which also provides more detail.
-
If a subtask’s
outPoolUsageis 100%, it is backpressured. Whether the subtask is already blocking or still writing records into network buffers depends on how full the buffers are, that theRecordWritersare currently writing into.
This is different to what the backpressure monitor is showing! -
An
inPoolUsageof 100% means that all floating buffers are assigned to channels and eventually backpressure will be exercised upstream. These floating buffers are in either of the following conditions: they are reserved for future use on a channel due to an exclusive buffer being utilised (remote input channels always try to maintain#exclusive bufferscredits), they are reserved for a sender’s backlog and wait for data, they may contain data and are enqueued in an input channel, or they may contain data and are being read by the receiver’s subtask (one record at a time). -
up to Flink 1.8: Due to FLINK-11082, an
inPoolUsageof 100% is quite common even in normal situations. -
Flink 1.9 and above: If
inPoolUsageis constantly around 100%, this is a strong indicator for exercising backpressure upstream.
The following table summarises all combinations and their interpretation. Bear in mind, though, that backpressure may be minor or temporary (no need to look into it), on particular channels only, or caused by other JVM processes on a particular TaskManager, such as GC, synchronisation, I/O, resource shortage, instead of a specific subtask.
outPoolUsage low |
outPoolUsage high |
|
|---|---|---|
inPoolUsage low |
(backpressured, temporary situation: upstream is not backpressured yet or not anymore) |
|
inPoolUsage high(Flink 1.9+) |
if all upstream tasks’outPoolUsage are low: (may eventually cause backpressure) |
(backpressured by downstream task(s) or network, probably forwarding backpressure upstream) |
if any upstream task’soutPoolUsage is high: (may exercise backpressure upstream and may be the source of backpressure) |
We may even reason more about the cause of backpressure by looking at the network metrics of the subtasks of two consecutive tasks:
- If all subtasks of the receiver task have low
inPoolUsagevalues and any upstream subtask’soutPoolUsageis high, then there may be a network bottleneck causing backpressure. Since network is a shared resource among all subtasks of a TaskManager, this may not directly originate from this subtask, but rather from various concurrent operations, e.g. checkpoints, other streams, external connections, or other TaskManagers/processes on the same machine.
Backpressure can also be caused by all parallel instances of a task or by a single task instance. The first usually happens because the task is performing some time consuming operation that applies to all input partitions. The latter is usually the result of some kind of skew, either data skew or resource availability/allocation skew. In either case, you can find some hints on how to handle such situations in the What to do with backpressure? box below.
- If
floatingBuffersUsageis not 100%, it is unlikely that there is backpressure. If it is 100% and any upstream task is backpressured, it suggests that this input is exercising backpressure on either a single, some or all input channels. To differentiate between those three situations you can useexclusiveBuffersUsage:- Assuming that
floatingBuffersUsageis around 100%, the higher theexclusiveBuffersUsagethe more input channels are backpressured. In an extreme case ofexclusiveBuffersUsagebeing close to 100%, it means that all channels are backpressured.
- Assuming that
The relation between `exclusiveBuffersUsage`, `floatingBuffersUsage`, and the upstream tasks' `outPoolUsage` is summarised in the following table and extends on the table above with `inPoolUsage = floatingBuffersUsage + exclusiveBuffersUsage`:
exclusiveBuffersUsage low |
exclusiveBuffersUsage high |
|
|---|---|---|
floatingBuffersUsage low +all upstream outPoolUsage low |
-3 | |
floatingBuffersUsage low +any upstream outPoolUsage high |
(potential network bottleneck) |
-3 |
floatingBuffersUsage high +all upstream outPoolUsage low |
(backpressure eventually appears on only some of the input channels) |
(backpressure eventually appears on most or all of the input channels) |
floatingBuffersUsage high +any upstream outPoolUsage high |
(backpressure on only some of the input channels) |
(backpressure on most or all of the input channels) |
3 this should not happen
Resource Usage / Throughput #
Besides the obvious use of each individual metric mentioned above, there are also a few combinations providing useful insight into what is happening in the network stack:
-
Low throughput with frequent
outPoolUsagevalues around 100% but lowinPoolUsageon all receivers is an indicator that the round-trip-time of our credit-notification (depends on your network’s latency) is too high for the default number of exclusive buffers to make use of your bandwidth. Consider increasing the buffers-per-channel parameter or try disabling credit-based flow control to verify. -
Combining
numRecordsOutandnumBytesOuthelps identifying average serialised record sizes which supports you in capacity planning for peak scenarios. -
If you want to reason about buffer fill rates and the influence of the output flusher, you may combine
numBytesInRemotewithnumBuffersInRemote. When tuning for throughput (and not latency!), low buffer fill rates may indicate reduced network efficiency. In such cases, consider increasing the buffer timeout. Please note that, as of Flink 1.8 and 1.9,numBuffersOutonly increases for buffers getting full or for an event cutting off a buffer (e.g. a checkpoint barrier) and may lag behind. Please also note that reasoning about buffer fill rates on local channels is unnecessary since buffering is an optimisation technique for remote channels with limited effect on local channels. -
You may also separate local from remote traffic using numBytesInLocal and numBytesInRemote but in most cases this is unnecessary.
Assuming that you identified where the source of backpressure — a bottleneck — is located, the next step is to analyse why this is happening. Below, we list some potential causes of backpressure from the more basic to the more complex ones. We recommend to check the basic causes first, before diving deeper on the more complex ones and potentially drawing false conclusions.
Please also recall that backpressure might be temporary and the result of a load spike, checkpointing, or a job restart with a data backlog waiting to be processed. In that case, you can often just ignore it. Alternatively, keep in mind that the process of analysing and solving the issue can be affected by the intermittent nature of your bottleneck. Having said that, here are a couple of things to check.
System Resources #
Firstly, you should check the incriminated machines’ basic resource usage like CPU, network, or disk I/O. If some resource is fully or heavily utilised you can do one of the following:
- Try to optimise your code. Code profilers are helpful in this case.
- Tune Flink for that specific resource.
- Scale out by increasing the parallelism and/or increasing the number of machines in the cluster.
Garbage Collection #
Oftentimes, performance issues arise from long GC pauses. You can verify whether you are in such a situation by either printing debug GC logs (via -XX:+PrintGCDetails) or by using some memory/GC profilers. Since dealing with GC issues is highly application-dependent and independent of Flink, we will not go into details here (Oracle’s Garbage Collection Tuning Guide or Plumbr’s Java Garbage Collection handbook seem like a good start).
CPU/Thread Bottleneck #
Sometimes a CPU bottleneck might not be visible at first glance if one or a couple of threads are causing the CPU bottleneck while the CPU usage of the overall machine remains relatively low. For instance, a single CPU-bottlenecked thread on a 48-core machine would result in only 2% CPU use. Consider using code profilers for this as they can identify hot threads by showing each threads’ CPU usage, for example.
Thread Contention #
Similarly to the CPU/thread bottleneck issue above, a subtask may be bottlenecked due to high thread contention on shared resources. Again, CPU profilers are your best friend here! Consider looking for synchronisation overhead / lock contention in user code — although adding synchronisation in user code should be avoided and may even be dangerous! Also consider investigating shared system resources. The default JVM’s SSL implementation, for example, can become contented around the shared /dev/urandom resource.
Load Imbalance #
If your bottleneck is caused by data skew, you can try to remove it or mitigate its impact by changing the data partitioning to separate heavy keys or by implementing local/pre-aggregation.
This list is far from exhaustive. Generally, in order to reduce a bottleneck and thus backpressure, first analyse where it is happening and then find out why. The best place to start reasoning about the “why” is by checking what resources are fully utilised.
Latency Tracking #
Tracking latencies at the various locations they may occur is a topic of its own. In this section, we will focus on the time records wait inside Flink’s network stack — including the system’s network connections. In low throughput scenarios, these latencies are influenced directly by the output flusher via the buffer timeout parameter or indirectly by any application code latencies. When processing a record takes longer than expected or when (multiple) timers fire at the same time — and block the receiver from processing incoming records — the time inside the network stack for following records is extended dramatically. We highly recommend adding your own metrics to your Flink job for better latency tracking in your job’s components and a broader view on the cause of delays.
Flink offers some support for tracking the latency of records passing through the system (outside of user code). However, this is disabled by default (see below why!) and must be enabled by setting a latency tracking interval either in Flink’s configuration via metrics.latency.interval or via ExecutionConfig#setLatencyTrackingInterval(). Once enabled, Flink will collect latency histograms based on the granularity defined via metrics.latency.granularity:
single: one histogram for each operator subtaskoperator(default): one histogram for each combination of source task and operator subtasksubtask: one histogram for each combination of source subtask and operator subtask (quadratic in the parallelism!)
These metrics are collected through special “latency markers”: each source subtask will periodically emit a special record containing the timestamp of its creation. The latency markers then flow alongside normal records while not overtaking them on the wire or inside a buffer queue. However, a latency marker does not enter application logic and is overtaking records there. Latency markers therefore only measure the waiting time between the user code and not a full “end-to-end” latency. User code indirectly influences these waiting times, though!
Since LatencyMarkers sit in network buffers just like normal records, they will also wait for the buffer to be full or flushed due to buffer timeouts. When a channel is on high load, there is no added latency by the network buffering data. However, as soon as one channel is under low load, records and latency markers will experience an expected average delay of at most buffer_timeout / 2. This delay will add to each network connection towards a subtask and should be taken into account when analysing a subtask’s latency metric.
By looking at the exposed latency tracking metrics for each subtask, for example at the 95th percentile, you should nevertheless be able to identify subtasks which are adding substantially to the overall source-to-sink latency and continue with optimising there.
Conclusion #
In the previous sections we discussed how to monitor Flink’s network stack which primarily involves identifying backpressure: where it occurs, where it originates from, and (potentially) why it occurs. This can be executed in two ways: for simple cases and debugging sessions by using the backpressure monitor; for continuous monitoring, more in-depth analysis, and less runtime overhead by using Flink’s task and network stack metrics. Backpressure can be caused by the network layer itself but, in most cases, is caused by some subtask under high load. These two scenarios can be distinguished from one another by analysing the metrics as described above. We also provided some hints at monitoring resource usage and tracking network latencies that may add up from sources to sinks.
Stay tuned for the third blog post in the series of network stack posts that will focus on tuning techniques and anti-patterns to avoid.