Scaling Flink automatically with Reactive Mode
May 6, 2021 - Robert Metzger (@rmetzger_)Introduction #
Streaming jobs which run for several days or longer usually experience variations in workload during their lifetime. These variations can originate from seasonal spikes, such as day vs. night, weekdays vs. weekend or holidays vs. non-holidays, sudden events or simply the growing popularity of your product. Although some of these variations are more predictable than others, in all cases there is a change in job resource demand that needs to be addressed if you want to ensure the same quality of service for your customers.
A simple way of quantifying the mismatch between the required resources and the available resources is to measure the space between the actual load and the number of available workers. As pictured below, in the case of static resource allocation, you can see that there’s a big gap between the actual load and the available workers — hence, we are wasting resources. For elastic resource allocation, the gap between the red and black line is consistently small.

Manually rescaling a Flink job has been possible since Flink 1.2 introduced rescalable state, which allows you to stop-and-restore a job with a different parallelism. For example, if your job is running with a parallelism of p=100 and your load increases, you can restart it with p=200 to cope with the additional data.
The problem with this approach is that you have to orchestrate a rescale operation with custom tools by yourself, including error handling and similar tasks.
Reactive Mode introduces a new option in Flink 1.13: You monitor your Flink cluster and add or remove resources depending on some metrics, Flink will do the rest. Reactive Mode is a mode where JobManager will try to use all TaskManager resources available.
The big benefit of Reactive Mode is that you don’t need any specific knowledge to scale Flink anymore. Flink basically behaves like a fleet of servers (e.g. webservers, caches, batch processing) that you can expand or shrink as you wish. Since this is such a common pattern, there is a lot of infrastructure available for handling such cases: all major cloud providers offer utilities to monitor specific metrics and automatically scale a set of machines accordingly. For example, this would be provided through Auto Scaling groups in AWS, and Managed Instance groups in Google Cloud. Similarly, Kubernetes provides Horizontal Pod Autoscalers.
What is interesting, as a side note, is that unlike most auto scalable “fleets of servers”, Flink is a stateful system, often processing valuable data requiring strong correctness guarantees (comparable to a database). But, unlike many traditional databases, Flink is resilient enough (through checkpointing and state backups) to adjust to changing workloads by just adding or removing resources, with very little requirements (i.e. simple blob store for state backups).
Getting Started #
If you want to try out Reactive Mode yourself locally, follow these steps using a Flink 1.13.0 distribution:
# These instructions assume you are in the root directory of a Flink distribution.
# Put Job into usrlib/ directory
mkdir usrlib
cp ./examples/streaming/TopSpeedWindowing.jar usrlib/
# Submit Job in Reactive Mode
./bin/standalone-job.sh start -Dscheduler-mode=reactive -Dexecution.checkpointing.interval="10s" -j org.apache.flink.streaming.examples.windowing.TopSpeedWindowing
# Start first TaskManager
./bin/taskmanager.sh start
You have now started a Flink job in Reactive Mode. The web interface shows that the job is running on one TaskManager. If you want to scale up the job, simply add another TaskManager to the cluster:
# Start additional TaskManager
./bin/taskmanager.sh start
To scale down, remove a TaskManager instance:
# Remove a TaskManager
./bin/taskmanager.sh stop
Reactive Mode also works when deploying Flink on Docker or using the standalone Kubernetes deployment (both only as application clusters).
Demo on Kubernetes #
In this section, we want to demonstrate the new Reactive Mode in a real-world scenario. You can use this demo as a starting point for your own scalable deployment of Flink on Kubernetes, or as a template for building your own deployment using a different setup.
The Setup #
The central idea of this demo is to use a Kubernetes Horizontal Pod Autoscaler, which monitors the CPU load of all TaskManager pods and adjusts their replication factor accordingly. On high CPU load, the autoscaler should add more TaskManagers, distributing the load across more machines. On low load, it should stop TaskManagers to save resources.
The whole setup is presented here:
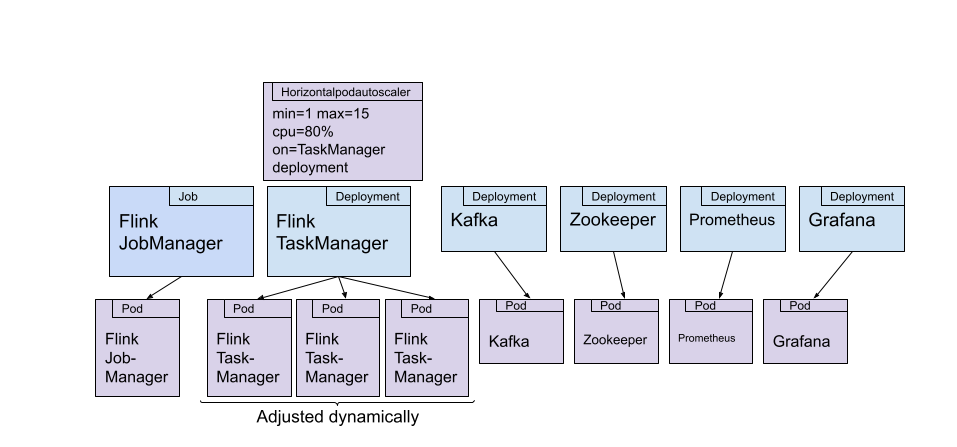
Let’s discuss the components:
Flink
- The JobManager is deployed as a Kubernetes job. We are submitting a container that is based on the official Flink Docker image, but has the jar file of our job added to it. The Flink job simply reads data from a Kafka topic and does some expensive math operations per event received. We use these math operations to generate high CPU loads, without requiring a large Kafka deployment.
- The TaskManager(s) are deployed as a Kubernetes deployment, which is scaled through a Horizontal Pod Autoscaler. In this experiment, the autoscaler is monitoring the CPU load of the pods in the deployment. The number of pods is adjusted between 1 and 15 pods by the autoscaler.
Additional Components:
- We have a Zookeeper and Kafka deployment (each with one pod) to provide a Kafka topic that serves as the input for the Flink job.
- The Data Generator pod produces simple string messages at a adjustable rate to the Kafka topic. In this experiment, the rate is following a sine wave.
- For monitoring, we are deploying Prometheus and Grafana.
The entire setup is available on GitHub if you want to try this out yourself.
Results #
We’ve deployed all the above components on a hosted Kubernetes cluster, running it for several days. The results are best examined based on the following Grafana dashboard:
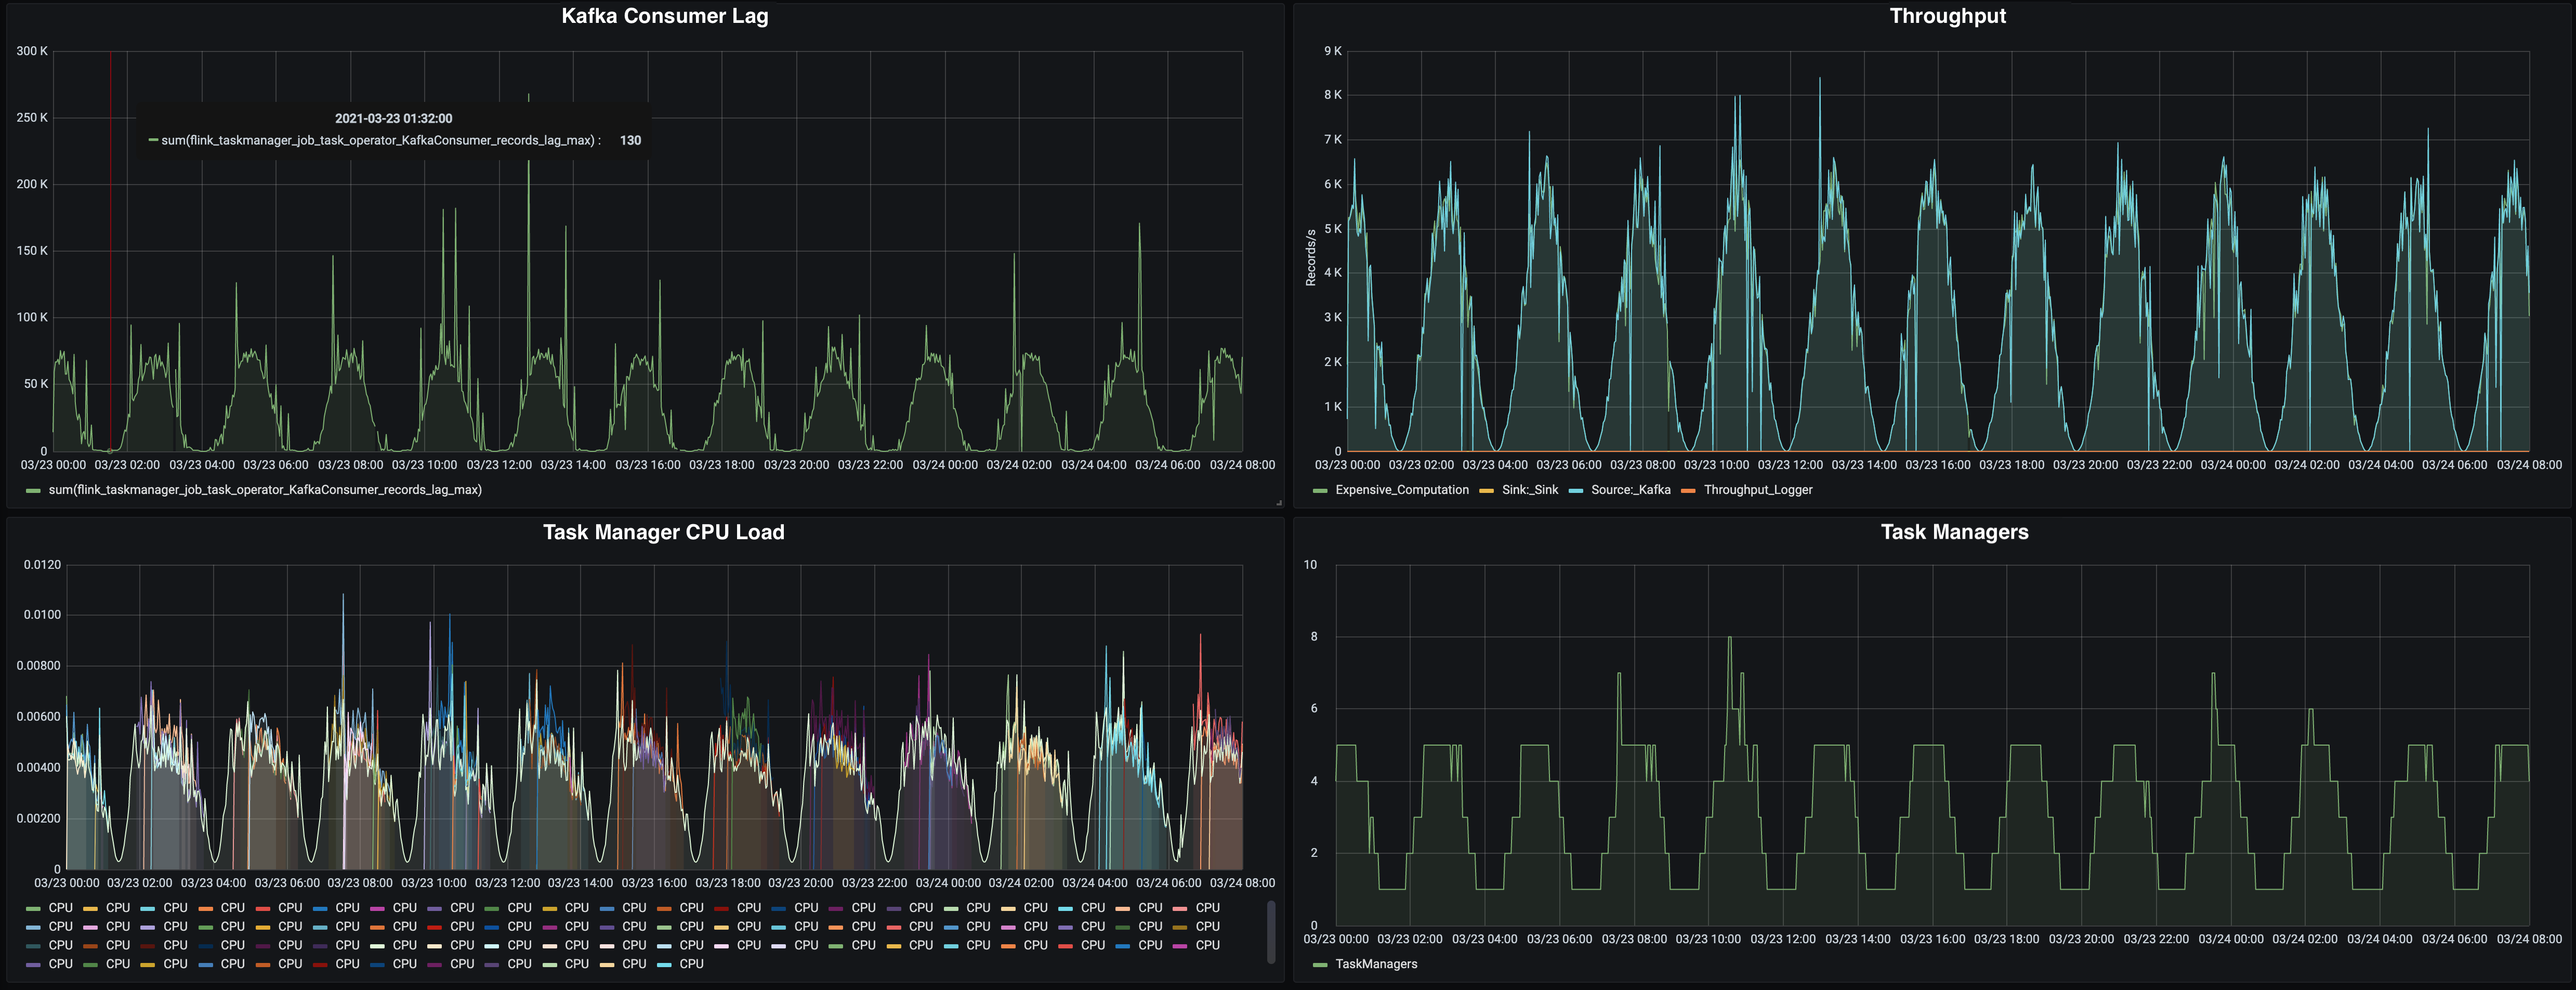
Reactive Mode Experiment Results
Let’s take a closer look at the dashboard:
-
On the top left, you can see the Kafka consumer lag, reported by Flink’s Kafka consumer (source), which reports the queue size of unprocessed messages. A high lag means that Flink is not processing messages as fast as they are produced: we need to scale up.
The lag is usually following the throughput of data coming from Kafka. When the throughput is the highest, the reported lag is at ~75k messages. In low throughput times, it is basically at zero.
-
On the top right, you’ll see the throughput, measured in records per second, as reported by Flink. The throughput is roughly following a sine wave, peaking at 6k messages per second, and going down to almost zero.
-
The bottom left chart shows the CPU load per TaskManager. We’ve added this metric to the dashboard because this is what the pod autoscaler in Kubernetes will use to decide on the replica count of the TaskManager deployment. You can see that, as soon as a certain CPU load is reached, additional TaskManagers are started.
-
In the bottom right chart, you can see the TaskManager count over time. When the throughput (and CPU load) is peaking, we’re running on 5 TaskManagers (with some peaks up to even 8). On low throughput, we’re running the minimal number of just one TaskManager. This chart showcases nicely that Reactive Mode is working as expected in this experiment: the number of TaskManagers is adjusting to the load on the system.
Lessons Learned: Configuring a low heartbeat timeout for a smooth scale down #
When we initially started with the experiment, we noticed some anomalies in the behavior of Flink, depicted in this chart:
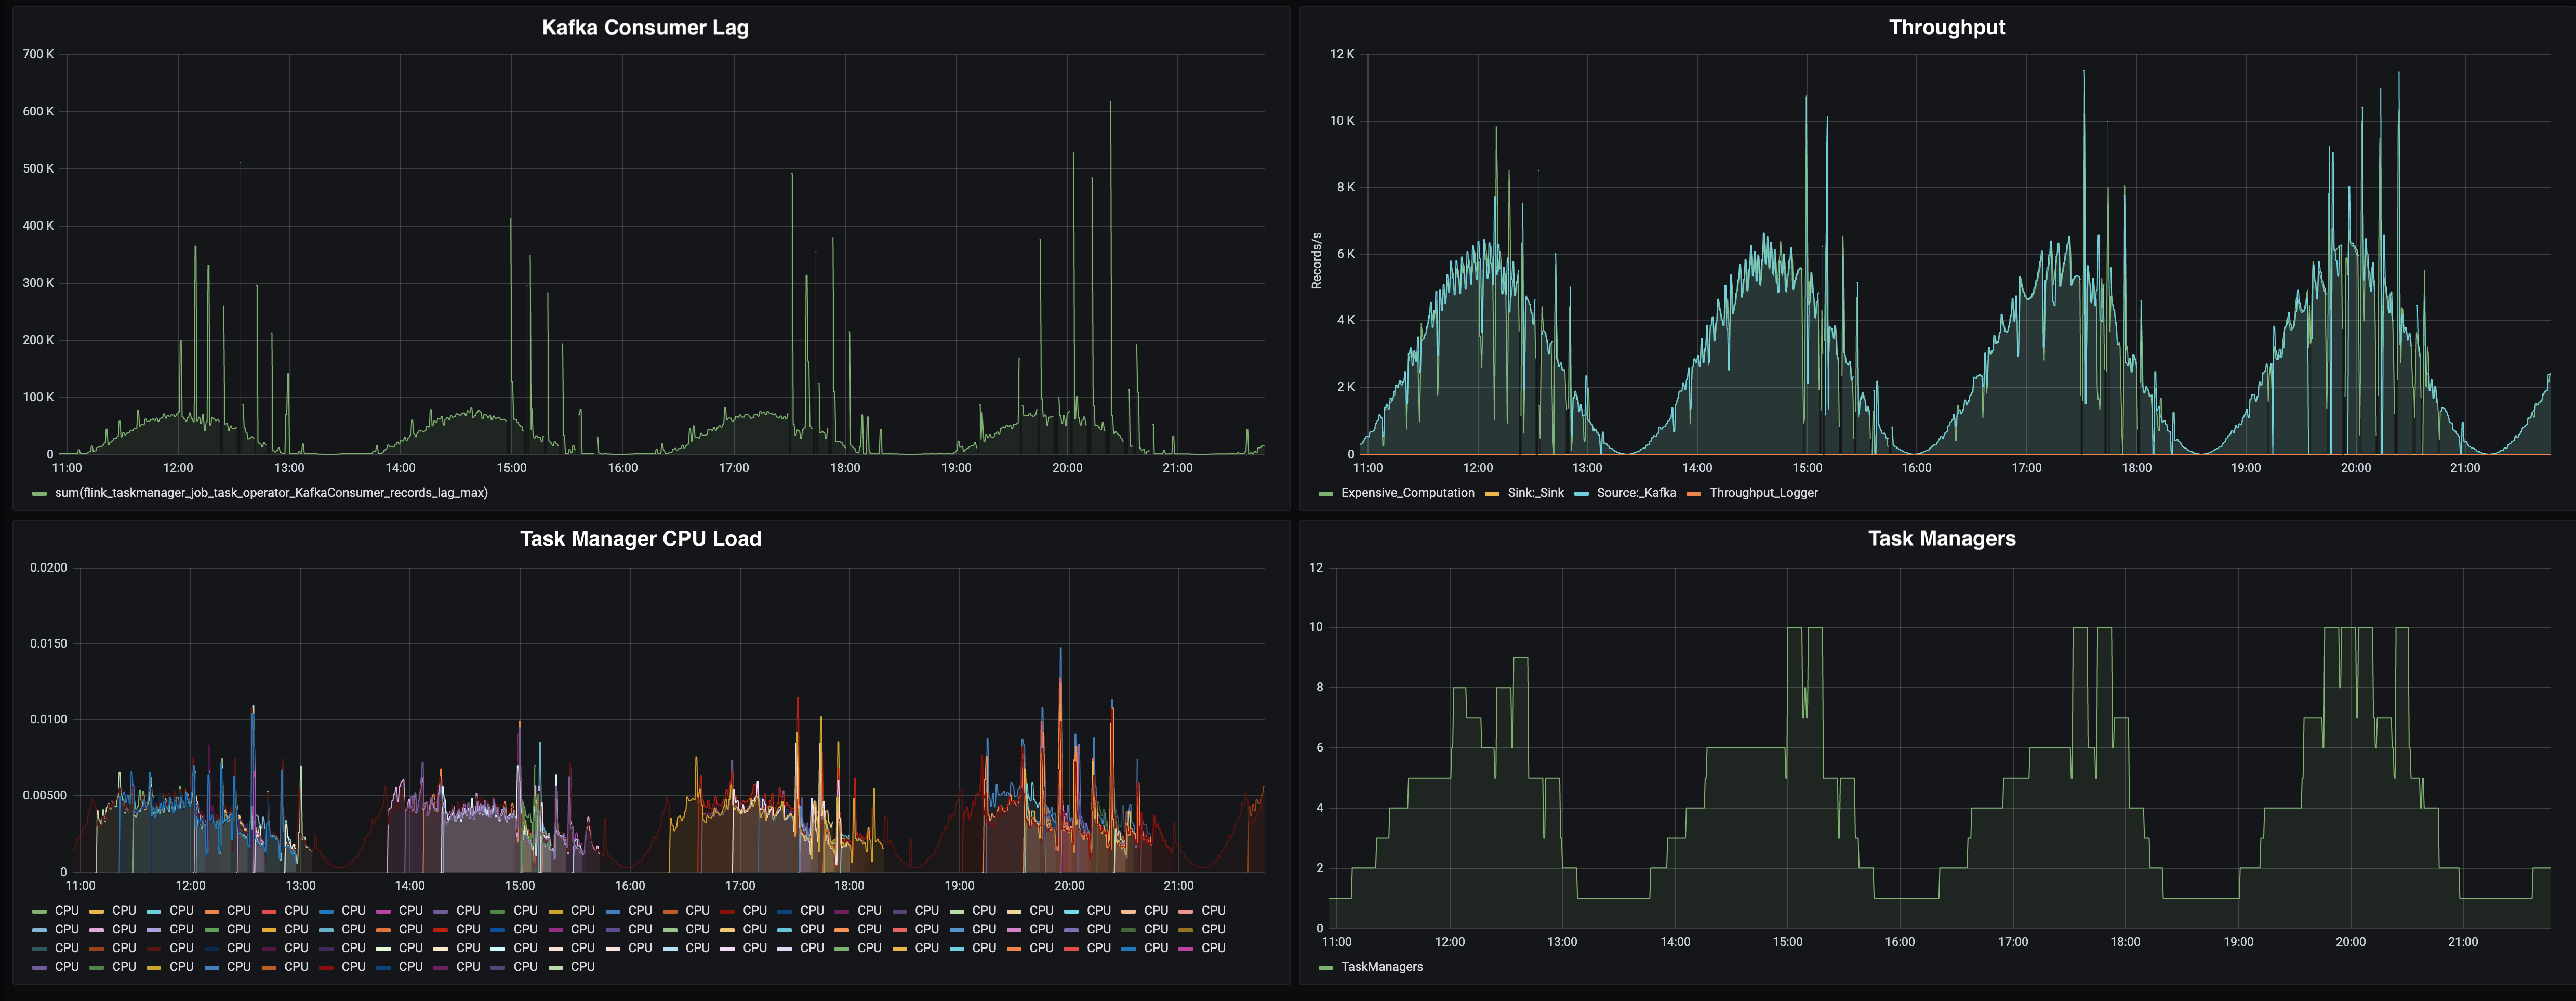
Reactive Mode not scaling down properly
In all the charts, we see sudden spikes or drops: The consumer lag is going to up to 600k messages (that’s 8 times more than the usual 75k lag we observe at peak), the throughput seems to peak (and drop). On the “Number of TaskManagers” chart, we see that we are not following the throughput line very nicely. We are wasting resources by allocating too many TaskManagers for the given at rate.
We see that these issues are only occurring when the load is decreasing, and Reactive Mode is supposed to scale down. So what is happening here?
The Flink JobManager is sending periodic heartbeats to the TaskManagers, to check if they are still alive. These heartbeats have a default timeout of 50 seconds. This value might seem high, but in high load scenarios, there might be network congestions, garbage collection pauses or other disruptions that cause slow heartbeats. We don’t want to consider a TaskManager dead just because of a temporary disruption.
However, this default value is causing problems in this experiment: When the Kubernetes autoscaler notices that the CPU load has gone down, it will reduce the replica count of the TaskManager deployment, stopping at least one TaskManager instance. Flink will almost immediately stop processing messages, because of the connection loss in the data transport layer of Flink. However, the JobManager will wait for 50 seconds (the default heartbeat timeout) before the TaskManager is considered dead.
During this waiting period, the throughput is at zero and messages are queuing in Kafka (causing spikes in the consumer lag). Once Flink is running again, Flink will try to catch up on the queued messages, causing a spike in CPU load. The autoscaler notices this load spike and allocates more TaskManagers.
We are only seeing this effect on scale down, because a scale down is much more disruptive than scaling up. Scale up, which means adding TaskManagers, is disrupting the processing only for the duration of a job restart (which is fast since our application state are just a few bytes for the Kafka offsets), while scaling down is disrupting the processing for roughly 50 seconds.
To mitigate this issue, we have reduced the heartbeat.timeout in our experiment to 8 seconds. Additionally, we are looking into improving the behavior of the JobManager to detect TaskManager losses better and faster.
Conclusion #
In this blog post, we’ve introduced Reactive Mode, a big step forward in Flink’s ability to dynamically adjust to changing workloads, reducing resource utilization and overall costs. The blog post demonstrated Reactive Mode on Kubernetes, including some lessons learned.
Reactive Mode is new feature in Flink 1.13 and is currently in the MVP (Minimal Viable Product) phase of product development. Before experimenting with it, or using it in production, please check the documentation, in particular the current limitations section. In this phase, the biggest limitation is that only standalone application mode deployments are supported (i.e. no active resource managers or session clusters).
The community is actively looking for feedback on this feature, to continue improving Flink’s resource elasticity. If you have any feedback, please reach out to the dev@ mailing list or to me personally on Twitter.